1
2
3
4
5
6
7
8
9
10
11
12
13
14
15
16
17
18
19
20
21
22
23
24
25
26
27
28
29
30
31
32
33
34
35
36
37
38
39
40
41
42
43
44
45
46
47
48
49
50
51
52
53
54
55
56
57
58
59
60
61
62
63
64
65
66
67
68
69
70
71
72
73
74
75# tplink-plug-exporter
Export TP-Link Smart Plug metrics to grafana dashboard
## Install
Download from [releases](https://github.com/fffonion/tplink-plug-exporter/releases) or run from docker
```
docker run -d -p 9233:9233 fffonion/tplink-plug-exporter
```
### Usage
Use the -h flag to see full usage:
```
$ tplink-plug-exporter -h
Usage of tplink-plug-exporter:
-metrics.listen-addr string
listen address for tplink-plug exporter (default ":9233")
```
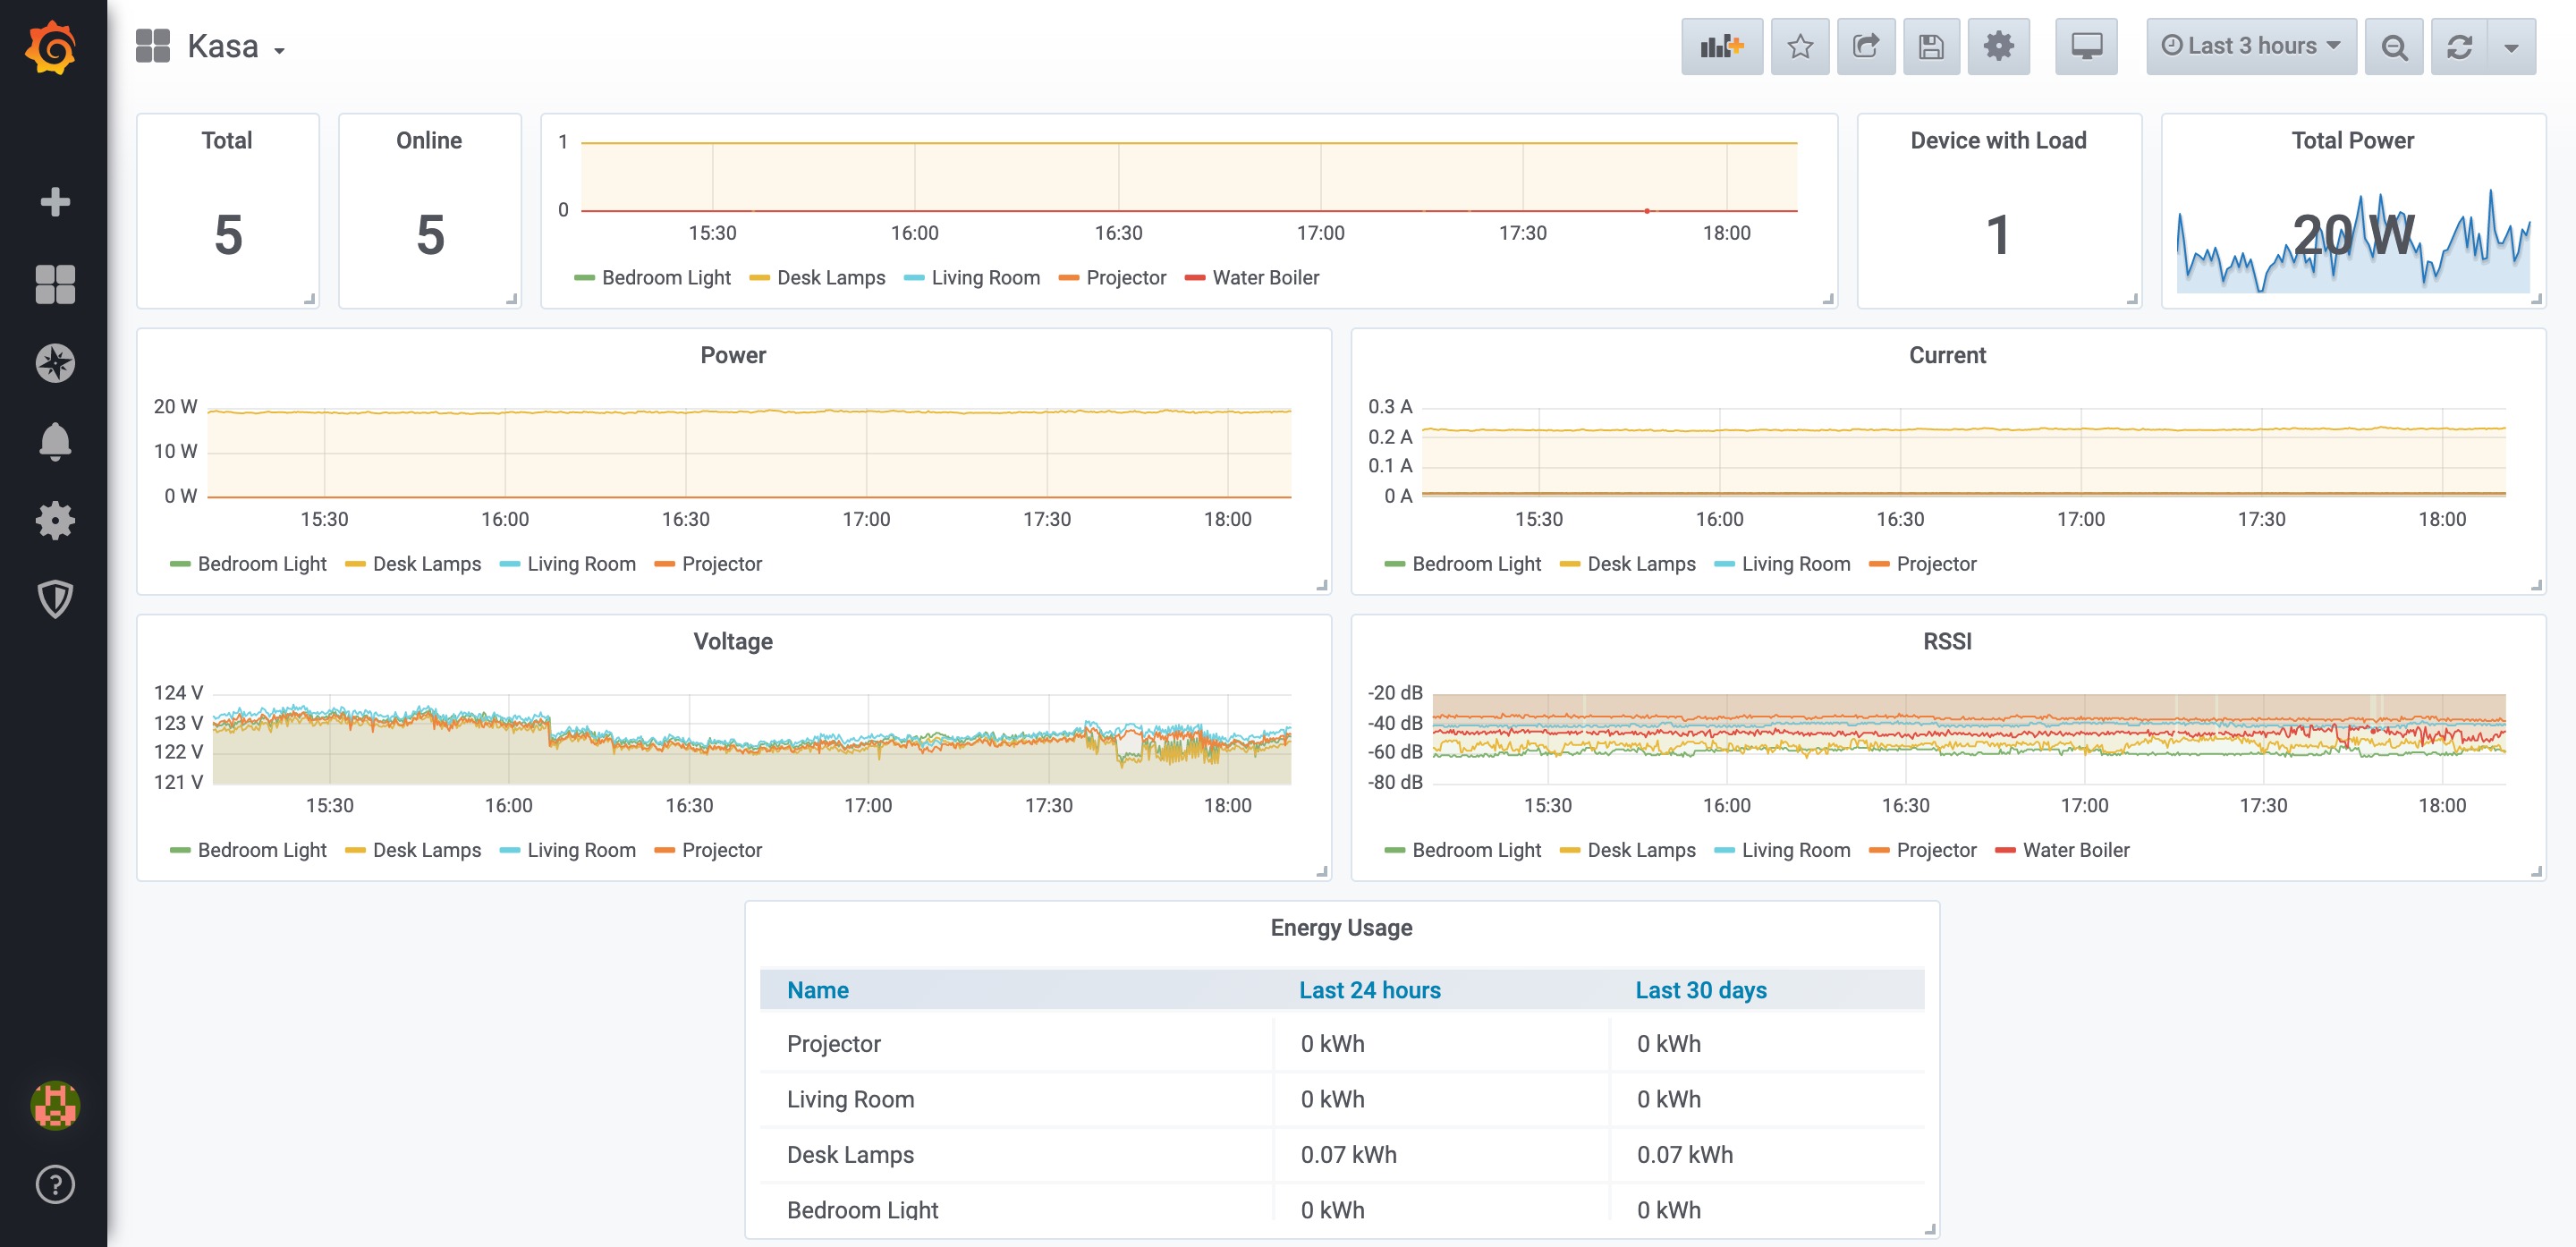
## Grafana dashboard
Search for `Kasa` inside grafana or install from https://grafana.com/grafana/dashboards/10957
## Sample prometheus config
```yaml
# scrape kasa devices
scrape_configs:
- job_name: 'kasa'
static_configs:
- targets:
# IP of your smart plugs
- 192.168.0.233
- 192.168.0.234
metrics_path: /scrape
relabel_configs:
- source_labels : [__address__]
target_label: __param_target
- source_labels: [__param_target]
target_label: instance
- target_label: __address__
# IP of the exporter
replacement: localhost:9233
# scrape kasa_exporter itself
- job_name: 'kasa_exporter'
static_configs:
- targets:
# IP of the exporter
- localhost:9233
```
## Docker Build Instructions
Build for both `arm64` and `amd64`:
```
docker build -t <image-name>:latest-arm64 --platform linux/arm64 --build-arg GOARCH=arm64 .
docker build -t <image-name>:latest-amd64 --platform linux/amd64 --build-arg GOARCH=amd64 .
```
Merge them in one manifest:
```
docker manifest create <image-name>:latest --amend <image-name>:latest-arm64 --amend <image-name>:latest-amd64
docker manifest push <image-name>:latest
```
## See also
- Original reverse engineering work: https://github.com/softScheck/tplink-smartplug
[](https://dartnode.com "Powered by DartNode - Free VPS for Open Source")